1. Unity mem profiler
1.1 官方文档
Summary 窗口
1.1.1 Memory usage on device
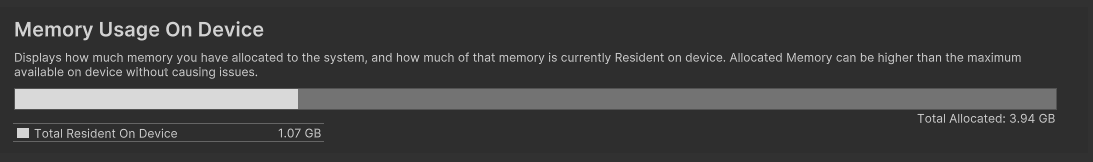
The application footprint in physical memory. It includes all Unity and non-Unity allocations resident in memory at the time of the capture.
意思是说,这里显示的是系统的总被使用的内存为3.94G。其它应用使用了1.07G。
但是我在xcode中看到
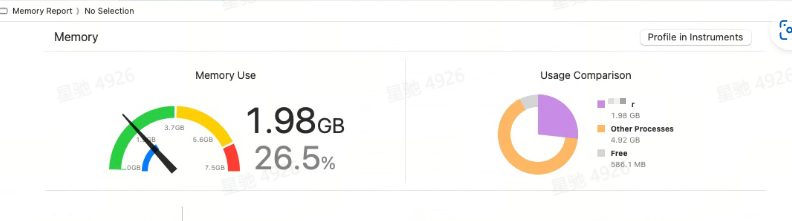
上面说应用全用了1.98个G内存。差距有点大。
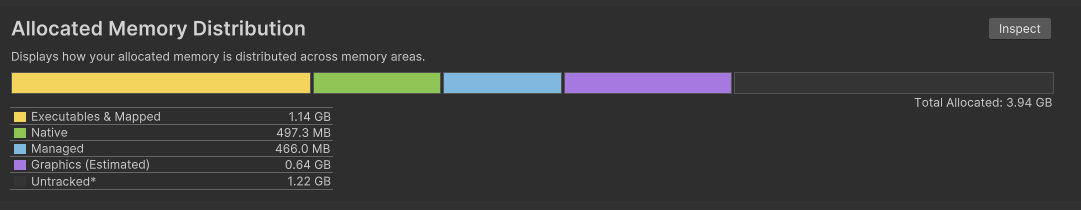
1.1.2 Allocated Memory Distribution
Displays how your allocated memory is distributed across different memory categories.
这里才是unity跟踪到的内存分配:总共有1.22G。但还是小于xcode中显示的,而且这里可以点inspect去查看具体是什么。
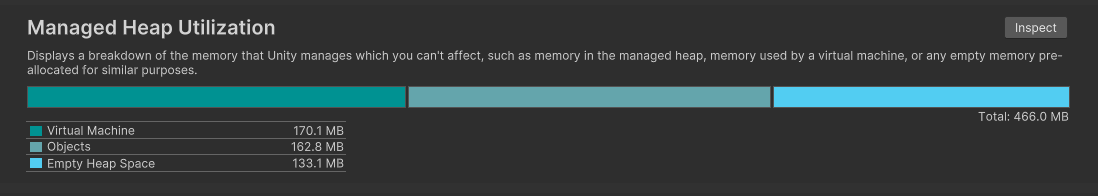
1.1.3 Managed Heap Utilization
意思是Unity内存分配的内存,不是用户分配的,
Displays a breakdown of the memory that Unity manages which you can't affect, such as memory in the managed heap, memory used by a virtual machine, or any empty memory pre-allocated for similar purposes.
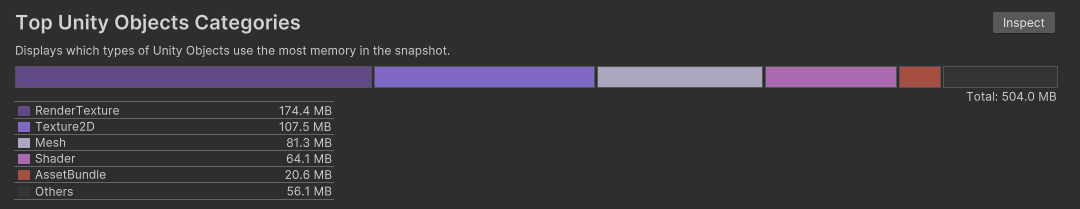
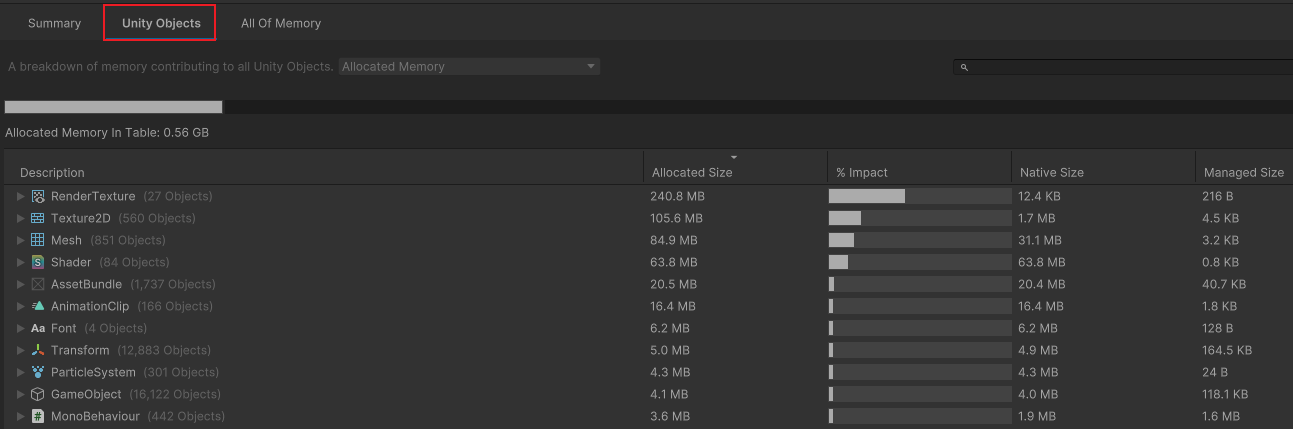
1.1.4 Top Unity Objects Categories
列出用 Allocated Memory Distribution中最大的几项
Displays which types of Unity Objects use the most memory in the snapshot.
1.2 如何分析
1.2.1 先了解应用占了多少内存
因为我们使用unity profiler工具来分析内存,所以我们只关心unity能跟踪到的内存使用,也就是 Allocated Memory Distribution中的数据 减去 untracked
3.94-1.22=2.72G1.2.2 关注总内存中占比最多的明细
在 Top Unity Objects Categories分类中,unity已经列出的前几项内存大头,可以点进去inspect去看看明细。
其中RenderTexuture有174M。
这个有可能和后处理、抗拒齿,或者hdr相关,可以尝试一个个关掉排除
1.2.3 查看all of memorys
All of memorys列出了unity跟踪到的所有内存分配明细,很有参考价值。
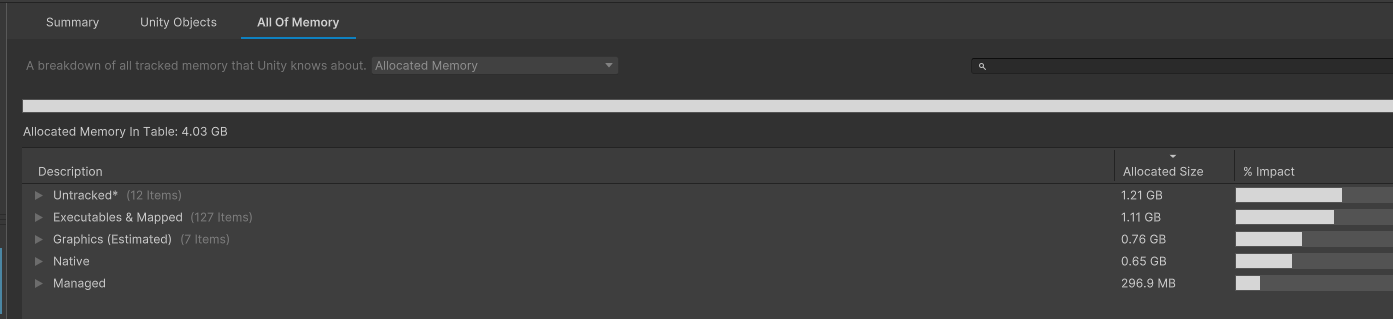
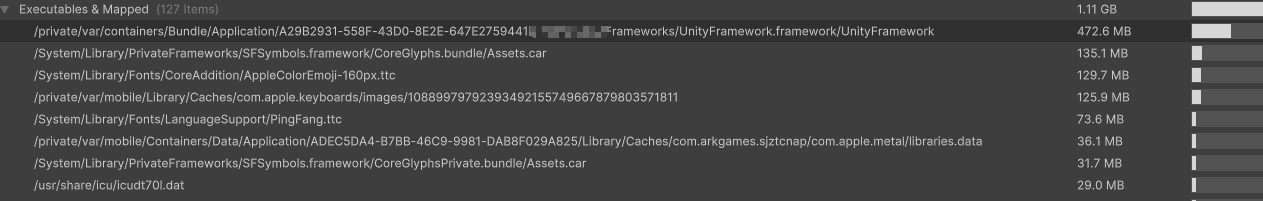
从上图看出,executes &mapped占用很大。
这是游戏使用的所有库的占用内存。
我这里打了一个空的Unity包,方便做对比
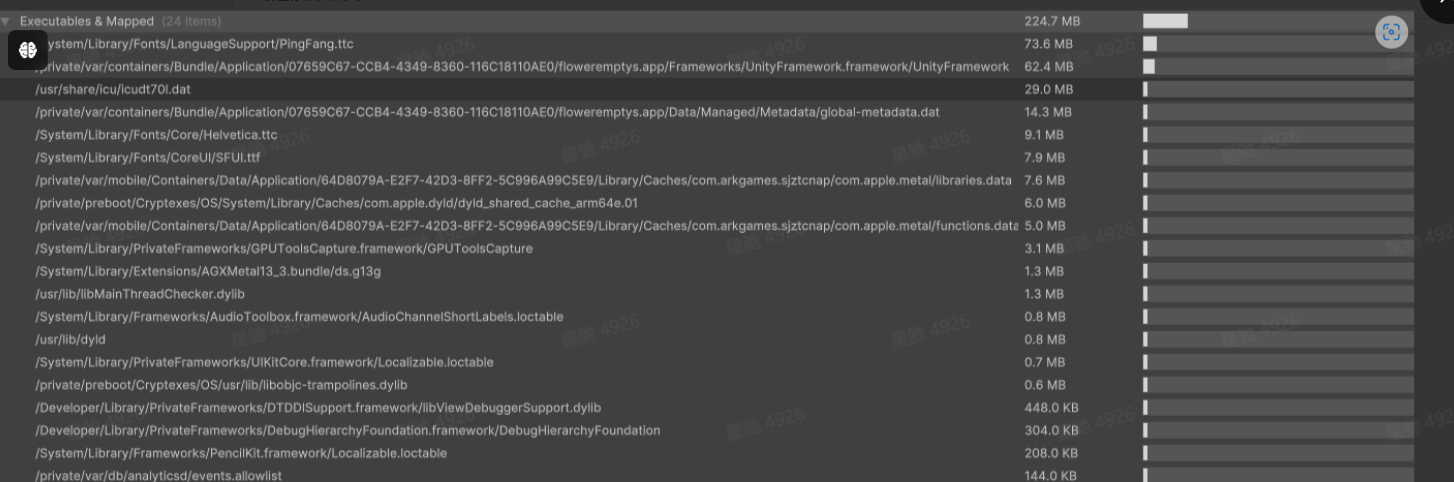
离谱吧,一个是224M一个是1.11G。
排查方向:
1、有没有开启unity库裁剪
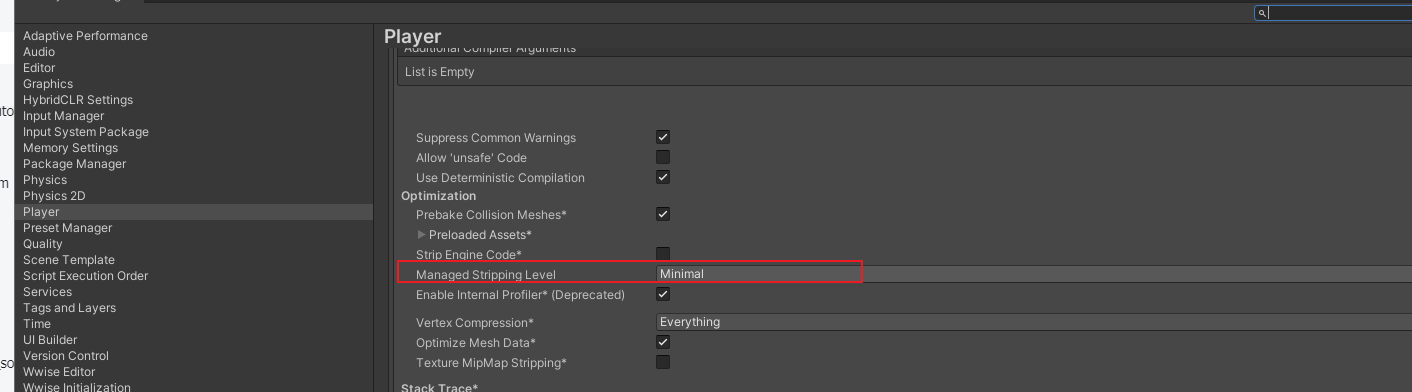
2、接入的其它sdk库是否过多
可以把其它的sdk第三库去掉,再测,看有没有优化
1.2.4 排查Managed Shell Objects内存泄露
参考:https://docs.unity3d.com/Packages/com.unity.memoryprofiler@1.1/manual/managed-shell-objects.html
unity的很多object对象,是用c++实现的,内存是unity分配的且不能被垃圾回收。在profiler中归类为Unity Objects
如下:
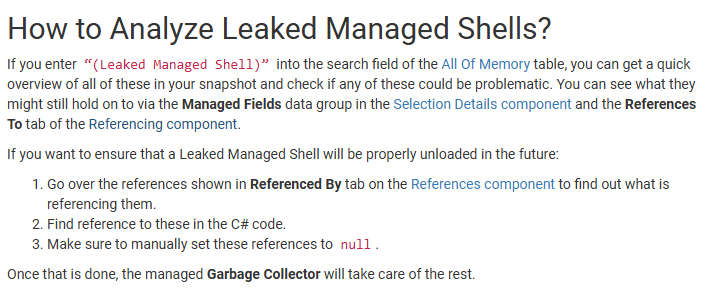
什么是Leaked Managed Shells
每一个unity object都对应一个c++对象。同时unity会new一个managed wrapper object来接管对native对象的调用。
如果一个unity object的c++对象已经被释放了,但是c#引用还没有释放,这就会导致Leaked Managed Shells也不会释放。(看了几遍,没具体明白)
在all of memorys中搜索leaked managed字样,就可以找到。